Giants stand at precipice of offensive infamy

Imagine thinking that Bengie Molina would make a good clean-up hitter. Imagine that, given the personnel available, it's probably the right decision.
Welcome to the world of the 2008 San Francisco Giants, a team that has seemingly amassed a collection of players who don't seem capable of mounting a viable offense this year. This statement is not just a reaction to the small sample size of the early going. In fact, the Giants have run up a couple of sevens and outscored a number of teams so far, thanks in part to John Bowker's big league debut splash over the weekend. No, this notion is based mostly on preseason projections and the fact that, while the Giants have some players you'd welcome on your team as adjuncts to your stars (Aaron Rowand and Molina, for instance), in San Francisco they are being relied upon as bulwarks of offensive fortitude. And it's not like the team can point to mashers who are off to slow starts, a la David Ortiz, or who are idling on the disabled list; what we are seeing now is no mere April sleight of hand.
Because of this, there exists the strong possibility that the 2008 Giants can join the ranks of the worst offenses of the past 50 years. They might even have -- or not have in this case -- what it takes to make a run at being the very worst of all.
How are we gauging this? It's not a simple matter of looking at the teams that scored the fewest runs. We have to take context into account. Otherwise, the list would be dominated by pitchers' park teams from 1968 and 1972. What follows is a look at the worst offensive teams dating back to 1958, the year the Giants arrived in San Francisco. These were selected by using a combination of runs scored in league context and team EqA, with an emphasis on the latter. EqA is a stat developed by Baseball Prospectus that is "a measure of total offensive value per out, with corrections for league offensive level, home park, and team pitching. EqA considers batting as well as baserunning, but not the value of a position player's defense. The EqA adjusted for all time also has a correction for league difficulty."
The list below includes one or two teams that had the poorest showings in each of the past five decades. In order to avoid redundancy, if the same team from the same approximate time period appears twice on the list separated by at least a season, we're discussing only the lesser of the two teams.
The 2000s
2002-03 Detroit Tigers

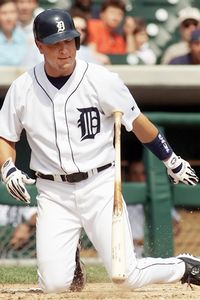
AP Photo/Duane Burleson
Shane Halter and the Tigers were one of the most ineffective offenses ever in 2002 and '03.
The culprits: In '02, the Tigers were plagued with half-time players like Chris Truby and Craig Paquette, who were way below replacement level. In '03, the keystone combo was a source of disaster in the persons of Omar Infante, Ramon Santiago and Shane Halter.
Not with the program: The '02 team had a few players above the water line, like Randall Simon and Robert Fick, their All-Star that year. Carlos Pena was decent in both seasons in a limited role. In 2003, Dmitri Young was genuinely very good, putting up a line of .297/.372/.537.
The rule of five: It's often said that if a team could somehow score exactly five runs every single game, it would be in pretty good shape. With average pitching, they would, at least, be in a position to win quite a few games. Of course, teams fluctuate. Going over and under five is a natural course of events. Not so these Tigers, though. They achieved a remarkable level of deprecatory consistency. On August 27, 2002, their record stood at 50-82. From that point on, they scored less than five runs on all but two occasions and went 5-23 the rest of the way.
2003 Los Angeles Dodgers

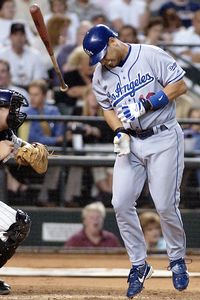
AP Photo/Tom Hood
Getting hit by this pitch helped Alex Cora get his on-base percentage all the way to .287.
The culprits: Alex Cora, Cesar Izturis and Adrian Beltre all had OBPs below .300, although Beltre led the team with 23 home runs.
Not with the program: In 2001 and '02, Shawn Green played at a Hall of Fame level. In '03, he had a dramatic transformation and drop in power, but was still the Dodgers' biggest offensive weapon among regulars. In a more limited role, Dave Ross had 10 homers in 124 at bats.
Found revenue: On a team starved for baserunners, you have to hand it to utility man Mike Kinkade. In only 191 plate appearances, he managed to get hit by 16 pitches. That's a percentage worthy of the great all-time plunked masters, Hughie Jennings and Ron Hunt.
The 1990s
1992 California Angels
 In 1992, Jim Abbott had the sixth-best VORP (Value Over Replacement Player) in the American League. The reward for his efforts? A 7-15 record. He pitched seven complete games and went 2-5 in them. This is what comes of playing for a team that is last in the league in walks and whose home run leader belted only 12. While it's important to remember that what was good in 1992 would pale in comparison to the offensive onslaught coming later in the decade, the '92 Angels were weak by any standard.
The culprits: In a lineup where no regular managed an OPS+ over league average, we'll have to go with shortstop Gary DiSarcina, who walked only 20 times in 553 plate appearances. Of course, that was very nearly his career high. Hubie Brooks ran a .216/.247/.337 line as the team's primary DH.
Not with the program: Chad Curtis had a promising rookie year and Luis Polonia did lead the team in OBP out of the leadoff spot, so, at the very least, they can say they had the right man for the job there. Reserve infielder Rene Gonzalez led the team in slugging average. The problem was, it was .398. He also hit into 17 double plays. The Angels had, by far, the fewest baserunners in the league, but they also lost the highest percentage to double plays.Attention should be paid: When discussing bad offenses and 1992, it would be remiss not to mention the Red Sox. While they don't rate among the elite run-deprived teams of the past 50 years, they're close enough to warrant a mention, because Fenway Park was a hitter's haven and they still managed to finish only 11th in runs scored at home. On the road, they were nearly the Angels' equal, outscoring them 271 to 268.
Well below average
The worst major league offenses from 1958-2007, as measured by the lowest percentage of runs per game in relation to the league average:
| Year | Team | Pct. |
| 1969 | Padres | .714 |
| 2002 | Tigers | .742 |
| 1965 | Mets | .749 |
| 1963 | Colt .45's | .751 |
| 2003 | Tigers | .751 |
| 1979 | Astros | .758 |
| 1981 | Blue Jays | .762 |
| 1964 | Colt .45's | .763 |
| 1998 | Devil Rays | .764 |
| 1983 | Mariners | .768 |
| 2003 | Dodgers | .769 |
1999 Minnesota Twins
 Compared to many of the teams on this list, the '99 Twins scored a ton of runs. The problem is one of context. A run total of 686 might humble the expansion teams from the '60s, but 1999 was an offensive war zone, and the Twins were fighting with a tuning fork compared to the bludgeoners in the league. Eight teams had at least 850 runs scored, and the Indians, with more than 1,000, were two runs per game better than Minnesota, which was shut out 10 times and held to one run on 22 occasions.
The culprits: The Twins were breaking in a lot of young players, a number of whom are still active. Torii Hunter, Cristian Guzman and Doug Mientkiewicz all did their part to keep things quiet on the bases. Jacque Jones' part-time line of .289/.329/.460 doesn't look too bad until you remember that the league slugging average was .439.
Not with the program: Corey Koskie made a good accounting of himself with a .310/.387/.468 line, but he played in only 117 games. Marty Cordova, the DH, had somewhat similar numbers.
Everything old is new again: If you think David Ortiz is struggling now, take a look at his stats with the '99 Twins. While he'll have plenty of time to recover this year, he was limited to just 20 at-bats nine years ago and failed to get a hit. He did walk five times. Ortiz, Chris Latham and Cleatus Davidson combined to go 5-for-64 with 29 strikeouts.
The 1980s
1981 Toronto Blue Jays
 Given the 54 games lost to the strike in 1981, one could argue that the Jays are at a disadvantage compared to the other teams on this list. If they'd played out a whole season, perhaps they arguably would not be the worst offensive team of the past 50 years. We'll never know, but it seems safe to say they still would be in the bottom 10. (As it is, this is probably the worst offense since 1958.) One could also argue that, if anything, the strike did them a favor. They were riding an 11-game losing streak when it began.
The culprits: When Alfredo Griffin is the leadoff man in more than two-thirds of your games, trouble is sure to follow. Griffin, never an offensive stalwart under the best of circumstances, had a particularly brutal go of it in 1981, making outs at an alarming rate. He came to the plate 414 times and made a whopping 315 outs. He reached base only 99 times and wiped himself out on failed stolen base attempts 12 times in 20 tries. When he wasn't batting in the top spot, the Jays were a decent 14-17. Otherwise, they were 23-52. Much has been written about Danny Ainge's ill-fated baseball career, and an .486 OPS was the last signpost on the road to the NBA. Damaso Garcia walked nine times and had 10 extra-base hits. Barry Bonnell, Al Woods, Ernie Whitt and future MVP George Bell were all especially inoffensive.
Not with the program: First baseman John Mayberry was the team's hitting star, posting a slugging average of .452. Designated hitter Otto Velez hit only .213 but made the rest of his plate appearances count, actually leading the team in OBP and finishing second to Mayberry in slugging percentage.
The team that laid the golden goose eggs: The Jays were shut out 20 times. That would have been staggering in a full season. In a year when everybody took most of the summer off, it's jaw-dropping. (One of those 20 was Len Barker's perfect game on May 15.) They didn't score in double figures even once. In games in which their pitchers surrendered five or more runs, they lost a remarkable 32 out of 33 times.
No bang for the buck
Worst team EqA*, 1958-2007:
| Year | Team | EqA |
| 1981 | Blue Jays | .2265 |
| 1981 | Twins | .2314 |
| 1965 | Mets | .2324 |
| 1992 | Angels | .2332 |
| 1963 | Mets | .2344 |
| 1999 | Twins | .2348 |
| 1979 | Blue Jays | .2352 |
| 1964 | Colt .45's | .2364 |
| 1983 | Mariners | .2367 |
| 1979 | A's | .2367 |
*Defined by Baseball Prospectus as "a measure of total offensive value per out, with corrections for league offensive level, home park, and team pitching. EqA considers batting as well as baserunning, but not the value of a position player's defense. The EqA adjusted for all time also has a correction for league difficulty."
-- Compiled by Clay Davenport
1983 Seattle Mariners
 The Mariners scored a half-run per game less than the next-worst team in the American League, the Texas Rangers. Like a lot of the teams presented here, the Mariners were last in the league in batting average, OBP and slugging.
The culprits: Al Cowens had had something of a resurgence the year before, hearkening back to his glory season with the '77 Royals. In 1983 though, he collapsed, running out a line of .205/.255/.329 in an injury-shortened season. Not to blame the shortstop again, but rookie Spike Owen went .196/.257/.271. Catcher Rick Sweet had similar numbers.
Not with the program: Seattle had a core of competent players who had marginally successful seasons. Pat Putnam, Tony Bernazard, Dave and Steve Henderson were all a win or so above replacement level.
That sounds about right: The most productive offense in the league belonged to the division champion Chicago White Sox. They averaged a run and a half more per game than Seattle. Head to head, they beat the Mariners 11 out of 12 times, outscoring them 81 to 31 in the process. The worst beating was a 12-0 shutout on September 15 that was shortened to seven innings, presumably not by the 10-run rule. It came in the middle of a seven-game losing streak for Seattle, during which the Mariners scored only 11 runs.
The 1970s
1979 Oakland A's
 By 1979, the men who made the dynasty earlier in the decade were scattered to the four corners of baseball. In their place were the young and the ineffectual. The good news for the A's was that they scored 41 more runs than the woeful '78 club. The bad news was that so did just about everybody else in the league. Nine teams increased their runs scored by a higher percentage than the '79 A's, pretty much nullifying their gains.
The culprits: Mitchell Page blew out of the gate with two excellent seasons, including a rookie of the year award in 1977. Then, every phase of his offense declined: discipline, power and stolen-base success. So, while the league was a richer run-scoring environment, he was a drag on the offense rather than a boost. Rob Picciolo had two unintentional walks in 363 plate appearances. Second baseman Mike Edwards was an offensive vacuum.
Not with the program: First baseman Dave Revering and centerfielder Dwayne Murphy were the only players on the team with OPS+ over 100.
Bad offense bookends: Ironically, one of the greatest offensive forces of this or any other era shows up on two of this list's entries at the very beginning and end of his career. Rickey Henderson arrived in Oakland halfway through the '79 season and did OK for a 20-year-old. His play was about league average, hinting at what was to come with 33 steals and a good number of walks. Twenty-four years later, after toiling in the independent Atlantic League, he brought his 44-year-old self to the run-starved 2003 Dodgers for 84 plate appearances.
The 1960s
1965 New York Mets
 Manager Casey Stengel took the smart way out of this situation: He broke his hip and retired. As infamous as the first-year Mets of 1962 may have been, they at least knew how to dent the plate once in a while. Not so with the '65 team (nor, for that matter, the '63 team, which also rates in the bottom 10). They scored all of 495 runs. Only 237 of them came on the road. How bad was that in 1965? About 100 runs below average.
The culprits: It wasn't that anyone was historically awful; it was just that everyone was decidedly mediocre. The best batting average on the team was that of a 19-year old. Greg Goossen hit .290, but that was in just 31 at bats. The next-best was just .253. Catcher Chris Cannizzaro (.183/.270/.231) was probably the worst offensively, and right fielder Joe Christopher drove in just 40 runs in 148 games.
Not with the program: Everybody contributed to the lost cause, but Johnny Lewis did the least amount of damage. He and Ron Swoboda were the only Mets with an OPS+ over 100, but just barely at that.
Every dog has his day: On July 29, in the first game of a doubleheader, this team blasted the Cubs, 14-0. Without checking the box score, it would appear to be a juggernaut performance. The truth is, Cubs pitchers surrendered seven walks, and their defense made six errors. Mets pitcher Galen Cisco had two hits. The rest of the lineup went only 9-for-35. So, even when they were kicking butt, they weren't exactly taking names.
1964 Houston Colt .45's
 Of the 14 teams that have been launched since 1961, the worst first-year offense belongs to the 1969 San Diego Padres. Since 1958, they have the worst ratio of team runs per game to league runs per game. The 1998 Tampa Bay Devil Rays would probably rank as second-worst. The first-year Colt .45's from 1962 do not rate near the bottom. It was only afterward that they started to slip.
The culprits: Houston catchers, led by Jerry Grote and John Bateman, combined to post a slugging percentage of .268, which doesn't sound that bad when you consider that the whole team slugged .315, one of the five worst figures of the last 50 years. (The 1972 Rangers slugged .290!)
Not with the program: Walt Bond, who died three years later, led the team with 20 home runs and a .420 slugging percentage. Bob Aspromonte had the highest OBP on the team. Unfortunately, it was .329.
Doing the unlikely: Between 1958 and 2007, 1,254 team seasons took place. Among those 1,254 teams, the 1964 Milwaukee Braves have the fifth-best team EqA. So, what happened when they played the Colt .45's, owners of the eighth-worst team EqA of the same period? They got shut down. Houston took 12 of their 18 meetings, outscoring them 76-66.Will the Giants join these ranks? Their lineup certainly appears to be constructed for that very purpose. Consider how grim their scoring picture already looks and think again how much worse it would be if Bowker hadn't shown up on Saturday with a big -- albeit unsustainable -- debut splash. If four or five Giants can play way over their heads for the better part of the year, we won't have to add them to teams above. If they dial in to expectations, though, the nadir's the limit.
Jim Baker is a Baseball Prospectus author and frequent contributor to Page 2. He is also the co-author -- along with Larry Burke and Peter Thomas Fornatale -- of the new book "Change Up: An Oral History of 8 Key Events That Changed Baseball."
Comments
You must be signed in to post a comment